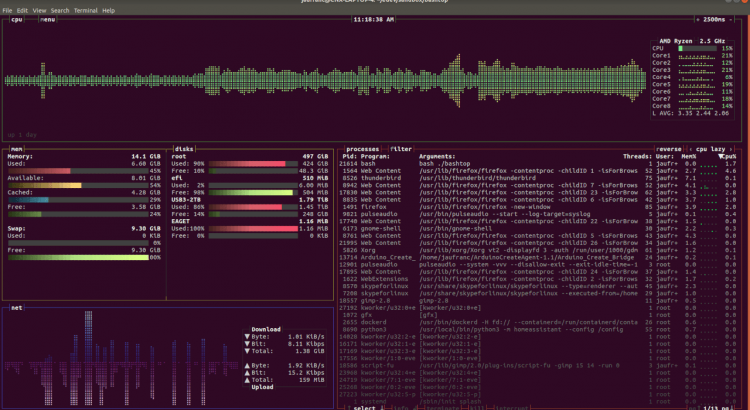
When writing software (in particular applications that can make intense use of the system resources, such as CPU, GPU, memory) it can be helpful to have a way to monitor how things are going, and this includes not only how the application is behaving but also if the entire system is sane and responsive.
In Windows this can be done at least in a couple of ways: through the Performance Counters or using the Windows API.
Performance Counters are:
“…a high-level abstraction layer that provides a consistent interface for collecting various kinds of system data such as CPU, memory, and disk usage. System administrators often use performance counters to monitor systems for performance or behavior problems. Software developers often use performance counters to examine the resource usage of their programs.“
Windows App Development Performance Counters doc page
The big selling point of the PerfCounters is that they wrap a really huge amount of information, spanning from the hardware configuration, processes info, resources usage, network traffic and so on. Everything can be easily queried thanks to a standardize query language.
Seems the perfect tool but they also have some cons, as well reported in the documentation:
“Windows Performance Counters are optimized for administrative/diagnostic data discovery and collection. They are not appropriate for high-frequency data collection or for application profiling since they are not designed to be collected more than once per second. For lower-overhead access to system information, you might prefer more direct APIs…“
Windows App Development – About Performance Counters
Not to mention that PerfCounters can get broken and in that case the entire database has to be rebuilt manually, as explained by this article. Anyway, should you wanted to play with PerfCounters, the Windows Performance Monitor is a simple tool that can be used to select and plot them.
The alternative solution to this (as also suggested in the “About Performance Counters” page) is to make use of Windows API calls, such as GetSystemTimes or GlobalMemoryStatusEx: these calls generally make use of Kernel descriptors and properties and are less prone to errors or whatever problem.
Not all the information available through Performance Counters are also (easily) available through the Windows API, so sometimes could save a lot of time and code to do a call to the PerfCounters – the relevant aspect is to understand that PerfCounters have a cost which is most of the times higher than a counterparty in the standard API.
We’ll check the simple use case where we want to monitor the Global CPU usage of the machine.
This can be easily done in C# in this way:
private PerformanceCounter _cpuCounter;
_cpuCounter = new PerformanceCounter("Processor", "% Processor Time", "_Total");
[...]
float cpuUsage = _cpuCounter.NextValue();
Put this code inside of a timer and the job is done.
To get the same using the Windows API we’ll have to work a bit more; we’ll have to pinvoke the syscall (GetSystemTimes, from kernel32.dll), and calculate the CPU% in a “step”, that is from a couple of subsequent read of the system times:
[DllImport("kernel32.dll", SetLastError = true)]
public static extern bool GetSystemTimes(out FILETIME lpIdleTime, out FILETIME lpKernelTime, out FILETIME lpUserTime);

private double CalcWin32()
{
    Win32.GetSystemTimes(out var idle, out var kernel, out var user);

    ulong currUser = user.ToQuad();
    ulong currKernel = kernel.ToQuad();
    ulong currIdle = idle.ToQuad();

    ulong u = currUser - _lastUser;
    ulong k = currKernel - _lastKernel;
    ulong i = currIdle - _lastIdle;

    ulong sys = k + u; // k includes idle
    double cpu = ((sys - i) * 100.0 / sys);

    _lastIdle = currIdle;
    _lastKernel = currKernel;
    _lastUser = currUser;
    return cpu;
}
The whole code can be downloaded from GitHub, but we can use it in a simple app and check in real time the cost of the operation (using a Stopwatch); the result is visualized here:

The small differences in the CPU% shown are due to the slightly staggered instants when the values are taken/calculated.
The take-away is that, “the operation to read the Global CPU usage costs 10x when done through PerfCounters“.
Overall it’s not a big performance drop if we just need a bunch of indicators but things can change dramatically if we need dozens of properties to be retrieved every second: this can cost something in the range [0% – 3%] of a single core, that can be non-negligible in some use cases.

